Sri Lanka asks PV system owners to disconnect after nationwide blackout
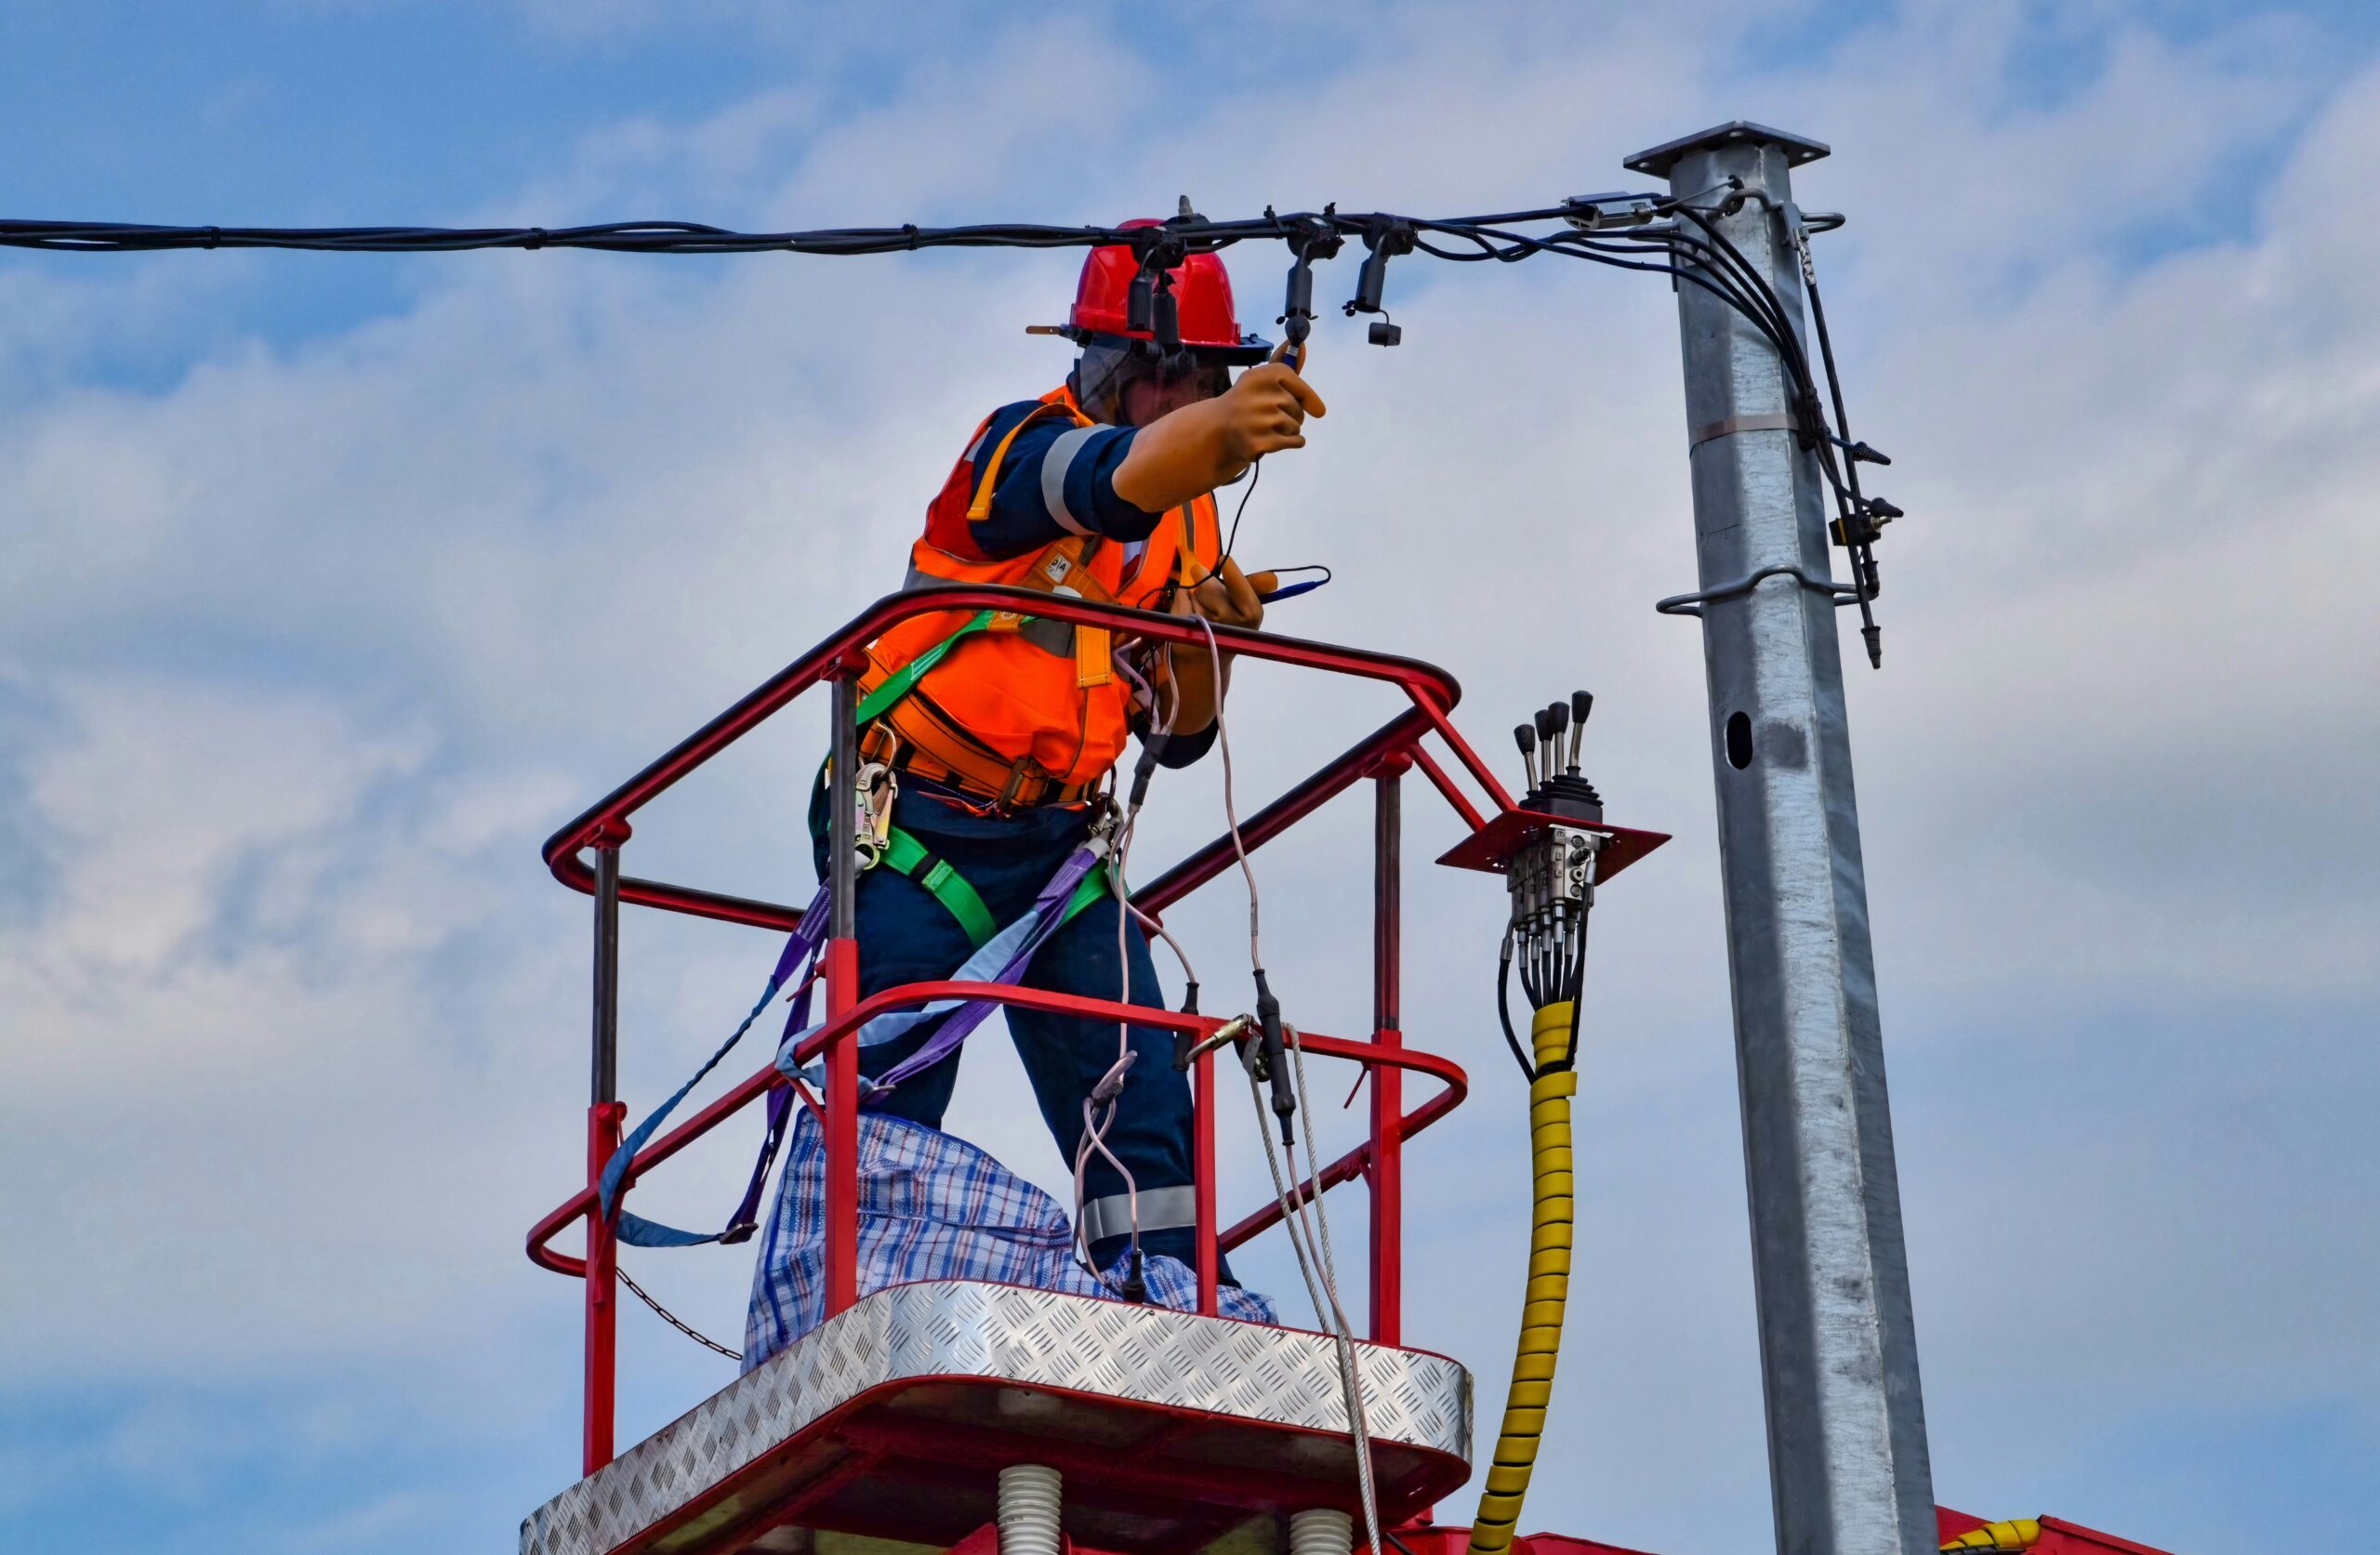
Sri Lanka's grid operator ordered all rooftop solar owners to disconnect their installations following a nationwide blackout on October 17, 2026. The outage was traced to instability in the transmission network. The grid took over eight hours to restore. This is the second such event in less than two years. In February 2025, a similar blackout occurred when solar PV accounted for more than 50% of instantaneous electricity demand, leaving insufficient system inertia to ride through a fault at a grid substation. At that time, the Ceylon Electricity Board confirmed high solar penetration as a major contributing factor. Sri Lanka's rooftop solar capacity reached 1.94 GW by end-2025 against a national average continuous demand of 2,400-2,500 MW.
Where this fits
This is a reliability event, not a renewable-generation event. High penetration of weather-dependent power degrades grid inertia. When solar supplies more than half instantaneous load, the system loses the rotating mass and electromagnetic properties of synchronous generation that dampen frequency swings and voltage disturbances. A single fault that a firm-backed grid would absorb as a voltage dip becomes a cascade. Sri Lanka has now had to tell its distributed solar owners to switch off to stabilise the network, the inverse of the energy-security promise that drove the build-out.
What it means
Australia's grid is moving toward Sri Lanka's fault condition. Firm power underpins stability. Solar and wind do not provide it. Where firm generation is gas, the whole-system cost rises (dual-plant capex, interconnection, transmission overbuild to manage variable output). Where it is nuclear, that cost disappears and emissions fall further. Sri Lanka's experience shows the cost of omitting it: not just money, but the humiliation of ordering citizens to disconnect their own rooftops to prevent blackouts.
By the numbers
at ~A$1100–1600/kW installed. Source: CSIRO GenCost 2024-25. Indicative.
at a ~24% capacity factor, and only when the sun shines, so it still needs firming.
~80% of modules are China-made. Source: IEA solar supply-chain data.
enough for 1–3 TWh a year of firm, always-on power, generating for ~60 years. Source: CSIRO GenCost 2024-25 (A$8.5–13.2bn/GW), IAEA capacity factor.
Figures are indicative conversions from the article's stated quantity using published cost, material and capacity factors (CSIRO GenCost, BNEF, IEA, IAEA). Ranges, not precise forecasts.
Go deeper on the numbers
The bigger picture
Energy security is national security. This connects to the wider case at Unprepared: Australia's dependence on a strategic rival, and how ready it is for the world that is coming.
Reported by PV Magazine (intl). Read the original report ↗
Related coverage
More batteries, both big and small, mean solar farms don’t have to shut down so often - Renew Economy
Concrete foundations completed for all 18 turbines at first and smallest wind farm to begin construction this year
Australia’s gas generation falls to lowest level since 2000 — OilPrice - UA.NEWS
Renewables Boom Pushes Australia's Gas Power to Quarter-Century Low - Crude Oil Prices Today | OilPrice.com
The numbers, as they move
A short, sourced brief when the figures shift: a transmission blow-out, a supply-chain move, a milestone.