Utility solar generation reaches record highs in NEM
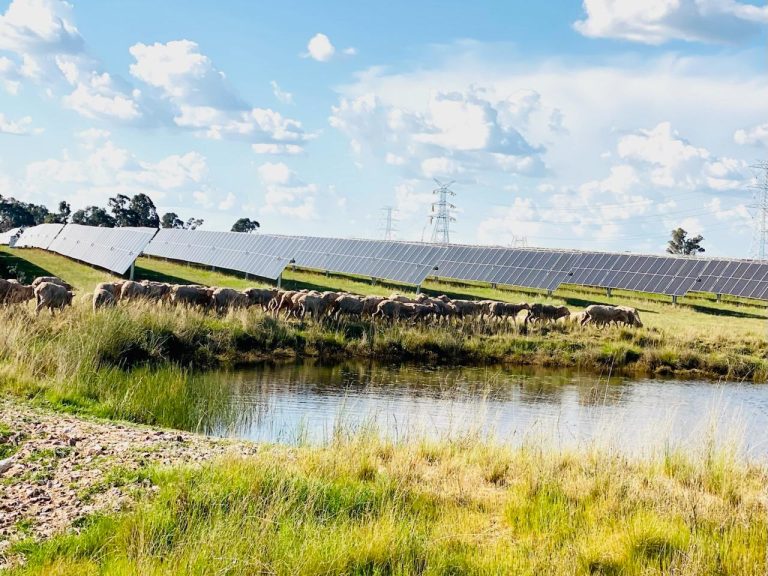
Utility-scale solar and wind assets in the National Electricity Market generated 5.44 TWh in September 2026, up 7% on the same month in 2025. Victoria led output with 1,526 GWh across solar and wind combined. Solar curtailment fell to 22% of available generation from 26% a year earlier, suggesting improved grid absorption. Three large solar farms, Stubbo (400 MW), Columboola (162 MW) and Edenvale (204 MW), achieved 35% average AC capacity factor. The article notes Stubbo's integration of sheep grazing as land-use co-benefit.
Where this fits
This data point sits on the reliability pressure. Rising utility solar output with falling curtailment looks like progress, but masks a harder question: where is the firm power coming from when the sun sets or a pressure system stalls over the mainland for days. The 5.44 TWh monthly output is real, but it tells nothing about what fills the gap between that generation and actual demand, and at what cost to the grid and the bill. Solar's capacity factor remains around 21, 35%, meaning most of the time most panels sit idle. The grid must still source or bank the dispatchable megawatts that sun-dependent supply cannot provide.
What it means
A growing solar fleet without equal growth in firm dispatchable capacity or long-duration storage does not solve reliability; it pushes the cost of firming (mostly gas-fired plant and battery cycling) higher and leaves the grid thinner in shoulder and winter months. Falling curtailment might signal better grid management, or simply that gas generation has had to run harder to absorb the swings. Australia remains locked into weather-dependent supply backed by fossil gas, while the low-emission firm alternative, nuclear, remains prohibited by law.
By the numbers
at ~A$1100–1600/kW installed. Source: CSIRO GenCost 2024-25. Indicative.
at a ~24% capacity factor, and only when the sun shines, so it still needs firming.
~80% of modules are China-made. Source: IEA solar supply-chain data.
enough for 0–1 TWh a year of firm, always-on power, generating for ~60 years. Source: CSIRO GenCost 2024-25 (A$8.5–13.2bn/GW), IAEA capacity factor.
Figures are indicative conversions from the article's stated quantity using published cost, material and capacity factors (CSIRO GenCost, BNEF, IEA, IAEA). Ranges, not precise forecasts.
Go deeper on the numbers
The bigger picture
Energy security is national security. This connects to the wider case at Unprepared: Australia's dependence on a strategic rival, and how ready it is for the world that is coming.
Reported by PV Magazine Australia. Read the original report ↗
Related coverage
More batteries, both big and small, mean solar farms don’t have to shut down so often - Renew Economy
Concrete foundations completed for all 18 turbines at first and smallest wind farm to begin construction this year
Australia’s gas generation falls to lowest level since 2000 — OilPrice - UA.NEWS
Renewables Boom Pushes Australia's Gas Power to Quarter-Century Low - Crude Oil Prices Today | OilPrice.com
The numbers, as they move
A short, sourced brief when the figures shift: a transmission blow-out, a supply-chain move, a milestone.