Renewables share hits record high in NEM
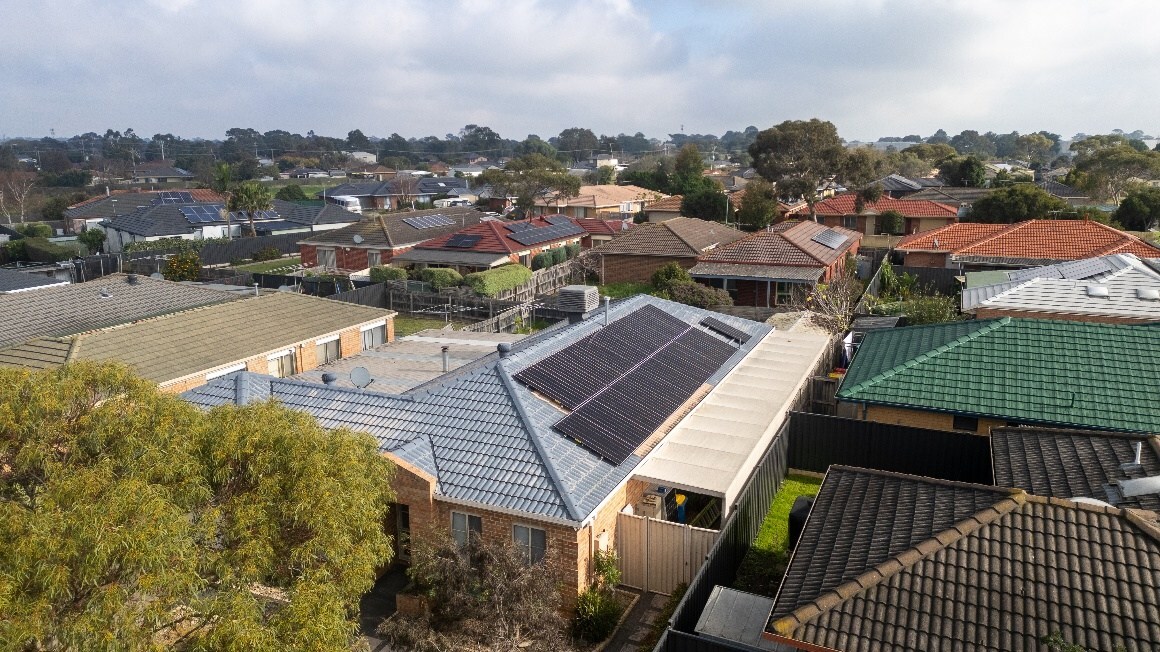
Australia's National Electricity Market set a new record on Saturday when renewables supplied 80.5% of total demand, with rooftop solar alone contributing more than half the renewable share. Consumption at the time was about 32.54 GW. The milestone came as the grid was curtailing 8.42 GW of available renewable output, comprising 4.23 GW of solar and 4.19 GW of wind. Storage facilities absorbed 5.33 GW during the peak, including 4.46 GW into batteries and 880 MW into pumped hydro. Sunday saw operational demand fall to a new low of 9,422 MW, with curtailment reaching 11,109 MW at peak midday.
Where this fits
The record reveals the reliability cost baked into a renewables-dominant grid. Curtailing over 11 GW of available output at midday means either the system is overbuilt to handle peak solar and wind hours, or demand-side management and storage are absorbing power at cost to balance a fundamentally weather-dependent supply. This is the real-world signature of firm-power scarcity: the grid now needs to throw away renewable electrons because it cannot firm them cheaply into the periods when the sun does not shine and wind does not blow. A nuclear plant would dispatch that 11 GW on demand, not force it away.
What it means
Australia is building abundance at noon and calling it progress, while remaining vulnerable to evening peaks and cloudy weeks. The curtailment figures show the system is now expensive to operate at high renewables share. Energy security means firm, dispatchable capacity. Records in renewable penetration at lunch hour do not measure grid resilience; they measure the widening gap between peak renewable output and the firm power that keeps demand met when weather fails.
By the numbers
at ~A$1100–1600/kW installed. Source: CSIRO GenCost 2024-25. Indicative.
at a ~24% capacity factor, and only when the sun shines, so it still needs firming.
~80% of modules are China-made. Source: IEA solar supply-chain data.
enough for 3–6 TWh a year of firm, always-on power, generating for ~60 years. Source: CSIRO GenCost 2024-25 (A$8.5–13.2bn/GW), IAEA capacity factor.
Figures are indicative conversions from the article's stated quantity using published cost, material and capacity factors (CSIRO GenCost, BNEF, IEA, IAEA). Ranges, not precise forecasts.
at ~A$2000–3200/kW installed. Source: CSIRO GenCost 2024-25. Indicative.
at a ~38% capacity factor, and only when the wind blows, so it still needs firming.
enough for 5–12 TWh a year of firm, always-on power, generating for ~60 years. Source: CSIRO GenCost 2024-25 (A$8.5–13.2bn/GW), IAEA capacity factor.
Figures are indicative conversions from the article's stated quantity using published cost, material and capacity factors (CSIRO GenCost, BNEF, IEA, IAEA). Ranges, not precise forecasts.
Go deeper on the numbers
The bigger picture
Energy security is national security. This connects to the wider case at Unprepared: Australia's dependence on a strategic rival, and how ready it is for the world that is coming.
Reported by PV Magazine Australia. Read the original report ↗
Related coverage
More batteries, both big and small, mean solar farms don’t have to shut down so often - Renew Economy
Concrete foundations completed for all 18 turbines at first and smallest wind farm to begin construction this year
Australia’s gas generation falls to lowest level since 2000 — OilPrice - UA.NEWS
Renewables Boom Pushes Australia's Gas Power to Quarter-Century Low - Crude Oil Prices Today | OilPrice.com
The numbers, as they move
A short, sourced brief when the figures shift: a transmission blow-out, a supply-chain move, a milestone.