Supply-side capacity in the NEM over the next 10 years (v1)
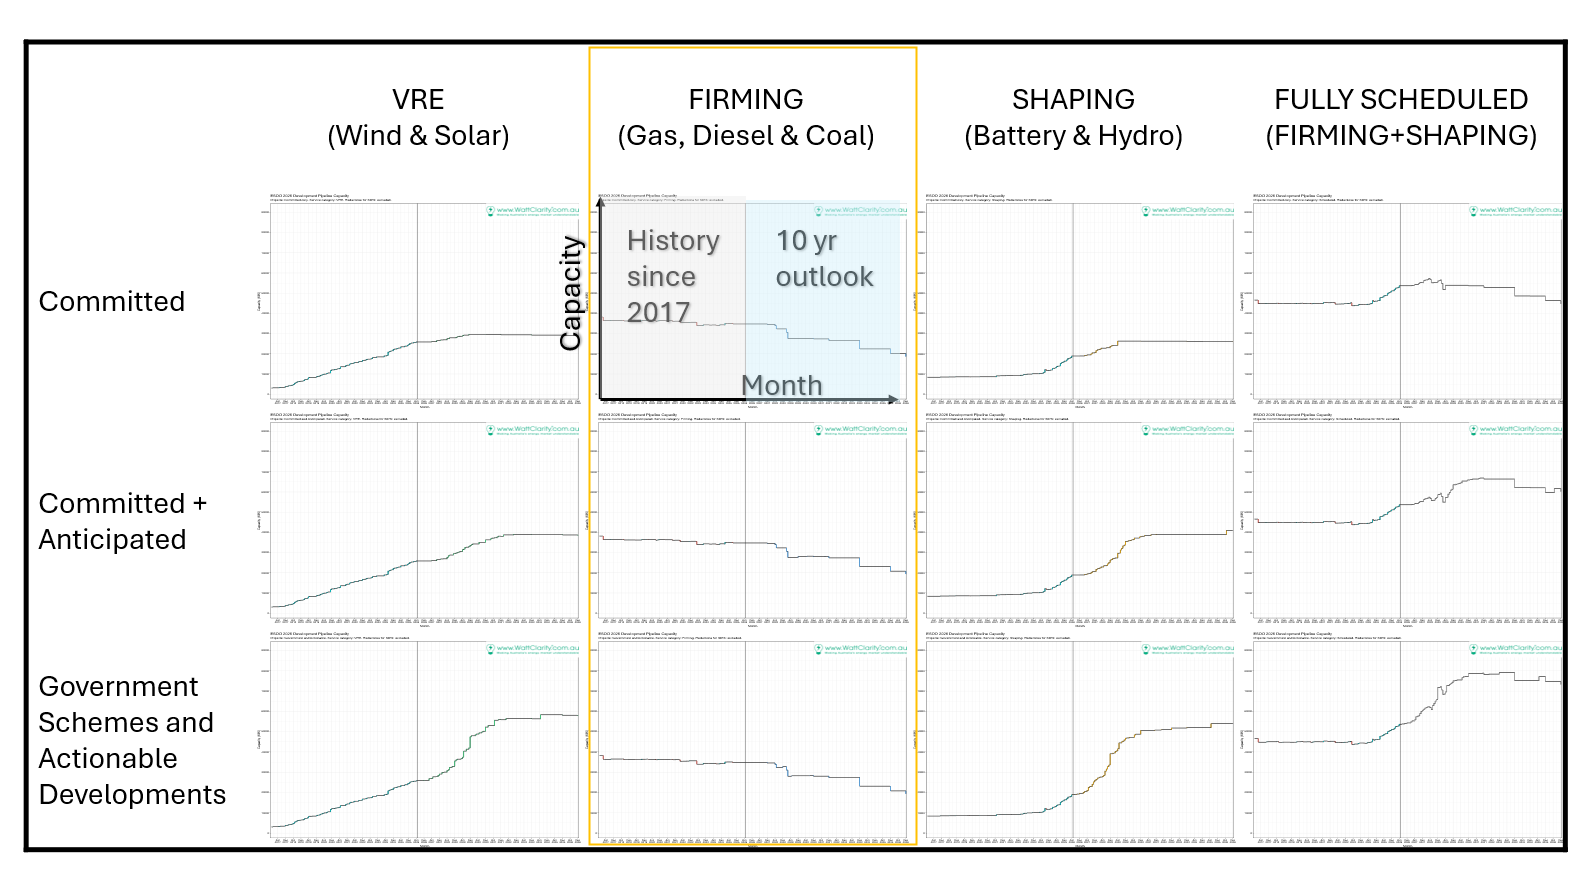
Linton Corbet's ESOO capacity outlook for the next decade reorganizes the NEM's supply side into three service categories: bulk energy (large-scale wind and solar), shaping (batteries and hydro), and firming (thermal generation). The framework distinguishes between variable renewable capacity and firm, dispatchable supply, then maps committed projects and two development scenarios across these service types. Snowy 2.0 is noted as potential very-long-duration storage capable of firming, though it remains in development.
Where this fits
This framework surfaces the hidden architecture of the electricity transition: that a renewables-heavy grid cannot be measured by capacity alone, because variable generation and firm generation serve fundamentally different roles. The distinction between bulk energy and firming exposes the cost that headlines elide. A grid built on variable renewables requires a full stack of firming capacity and shaping assets to deliver reliable supply; those costs are separate from, and often larger than, the per-megawatt-hour cost of the panels and turbines themselves. The matrix reveals how much scheduled, firm supply Australia is actually deploying against its variable fleet, and whether that gap is being closed by gas, long-duration storage, or the prohibited alternative of nuclear.
What it means
The categorization is honest about what the grid actually needs to do: provide energy on demand, not just install capacity. Whether committed projects and development scenarios actually deliver enough firm supply to avoid chronic gas dependence over the next decade is the question the matrix can answer. If firming capacity is lagging the buildout of bulk renewables, Australia faces either a locked-in reliance on gas for the 2030s, or a grid stability problem. The framework makes visible what a renewables-only path requires: not just solar and wind, but sufficient dispatchable capacity to cover the weather cycles they cannot.
By the numbers
at ~A$600–1000/kWh installed. Source: BNEF, CSIRO GenCost 2024-25. Indicative.
of average national (NEM) demand if fully dischargeable, then it needs recharging. Storage shifts power, it does not generate it.
lithium, graphite, nickel, copper and cobalt (~600 t lithium content). Replaced roughly every 12 years. Source: IEA, Argonne GREET. Indicative.
~75% of cells are China-made. Source: IEA cell-manufacturing share.
enough for 2–6 TWh a year of firm, always-on power, generating for ~60 years. Source: CSIRO GenCost 2024-25 (A$8.5–13.2bn/GW), IAEA capacity factor.
Figures are indicative conversions from the article's stated quantity using published cost, material and capacity factors (CSIRO GenCost, BNEF, IEA, IAEA). Ranges, not precise forecasts.
Go deeper on the numbers
The bigger picture
Energy security is national security. This connects to the wider case at Unprepared: Australia's dependence on a strategic rival, and how ready it is for the world that is coming.
Reported by WattClarity. Read the original report ↗
Related coverage
More batteries, both big and small, mean solar farms don’t have to shut down so often - Renew Economy
Concrete foundations completed for all 18 turbines at first and smallest wind farm to begin construction this year
Australia’s gas generation falls to lowest level since 2000 — OilPrice - UA.NEWS
Renewables Boom Pushes Australia's Gas Power to Quarter-Century Low - Crude Oil Prices Today | OilPrice.com
The numbers, as they move
A short, sourced brief when the figures shift: a transmission blow-out, a supply-chain move, a milestone.