80.9 GW quarterly pipeline of clean energy projects surpasses current 77 GW capacity

The pipeline of generation and storage projects in Australia's National Electricity Market has grown to 80.9 GW, exceeding the current fleet's 77 GW capacity for the first time. Battery energy storage systems dominate, representing 55% of the pipeline, followed by hybrid solar-battery (19%), wind (15%), standalone solar (5%), hydro (5%), and gas (1%). In the September quarter, AEMO received 25 new applications totalling 7.5 GW, with batteries accounting for 76% of that volume. Four battery projects connected to the grid in the quarter, delivering 1 GW of discharge capacity and 3.4 GWh of storage.
Where this fits
This acceleration in battery deployment reflects the grid's growing need for firming capacity as weather-dependent renewables scale. The composition of the pipeline, batteries now the dominant share, exposes the reliability problem: Australia is not building firm dispatchable power to anchor renewables, but rather stacking variable sources atop variable sources, then adding batteries to compensate. This is the high-cost, whole-system pattern Energy Realism identifies: renewables require firming, and firming (whether battery, gas, or overbuilt transmission) is not free or invisible.
What it means
Batteries are capital-intensive and short-lived. The minerals, lithium, cobalt, nickel, flow through China's supply chain, making Australia's energy security dependent on a strategic rival's processing monopoly and goodwill. The speed of deployment cannot compensate for the structural fact: a firm, energy-dense, low-material alternative, nuclear, remains banned by law. Australia is building the expensive path to the same reliability outcomes a smaller fleet of nuclear could deliver at lower whole-system cost and full resource sovereignty.
By the numbers
at ~A$600–1000/kWh installed. Source: BNEF, CSIRO GenCost 2024-25. Indicative.
of average national (NEM) demand if fully dischargeable, then it needs recharging. Storage shifts power, it does not generate it.
lithium, graphite, nickel, copper and cobalt (~340 t lithium content). Replaced roughly every 12 years. Source: IEA, Argonne GREET. Indicative.
~75% of cells are China-made. Source: IEA cell-manufacturing share.
enough for 1–3 TWh a year of firm, always-on power, generating for ~60 years. Source: CSIRO GenCost 2024-25 (A$8.5–13.2bn/GW), IAEA capacity factor.
Figures are indicative conversions from the article's stated quantity using published cost, material and capacity factors (CSIRO GenCost, BNEF, IEA, IAEA). Ranges, not precise forecasts.
Go deeper on the numbers
The bigger picture
Energy security is national security. This connects to the wider case at Unprepared: Australia's dependence on a strategic rival, and how ready it is for the world that is coming.
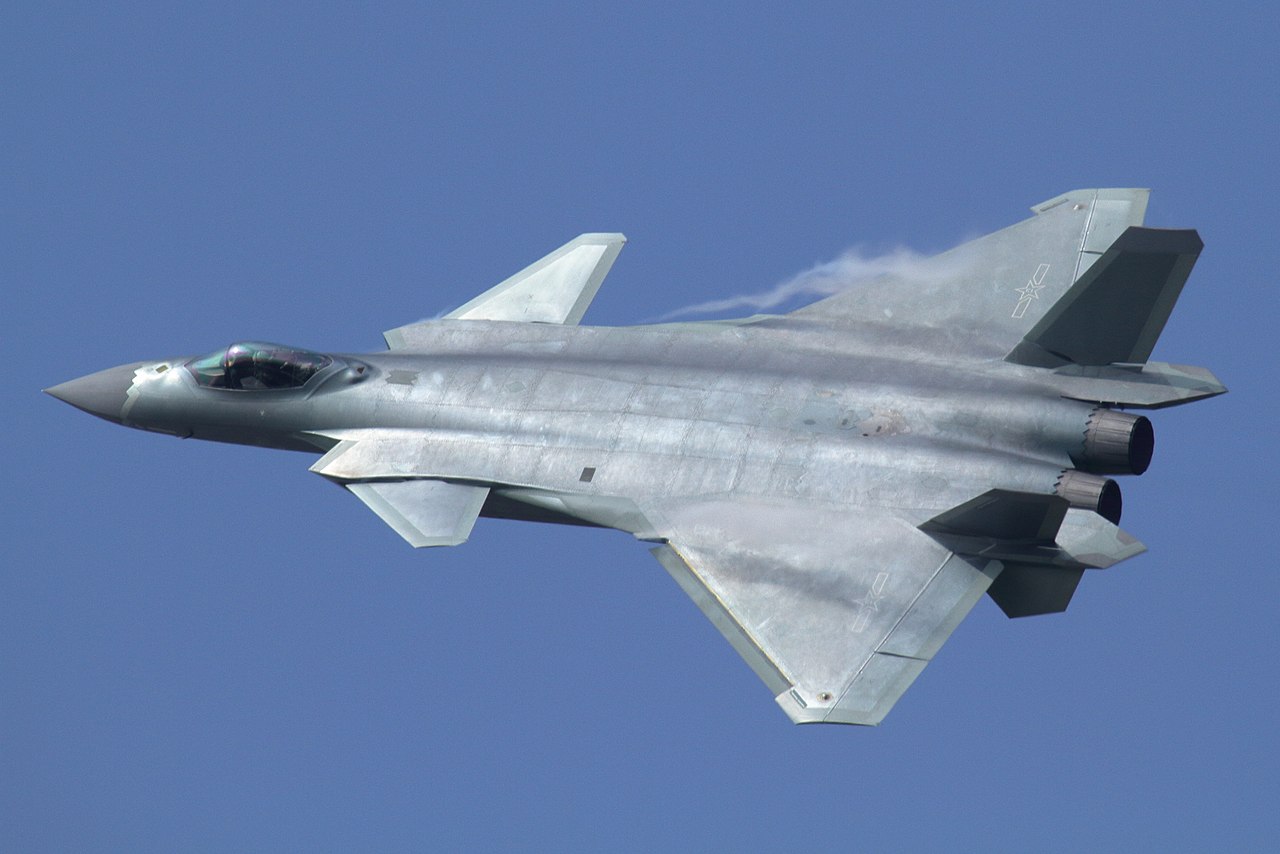
Xi Jinping and the Purge That Built an Army
The PLA that Xi Jinping inherited in 2012 was modernising, and the one he commands in 2026 is transformed. Part IV of the Unprepared series.
Reported by PV Magazine Australia. Read the original report ↗
Related coverage
What grid-forming kit are Australia’s largest solar–BESS hybrids using?
New four-hour battery storage proposal seeks federal green tick for Australia’s most renewable state grid
SA gives green light for gas to help power future data centres - ABC News & Headlines – Australian Broadcasting Corporation
Concentrated Solar Power (CSP) in Australia: Can It Work Alongside Rooftop Solar? - Energy Matters
The numbers, as they move
A short, sourced brief when the figures shift: a transmission blow-out, a supply-chain move, a milestone.